
Learn Pandas And Numpy in 5 mins
Become Pro in data analytics by learning pandas and numpy in 5 min


Hey everyone, I hope you're doing well! Today, I wanted to share some insights on two extremely useful libraries for data analysis - NumPy and Pandas. These libraries have the potential to double your efficiency and significantly reduce your workload. Whether you're a seasoned data analyst or just starting out, understanding these libraries is a must. In this blog, I'll share my knowledge on these libraries along with some tricks, tips, and practical applications, so you can make the most out of them. Let's dive in!
Introduction to Numpy and Pandas
What is Numpy?
Numpy is like a superhero toolkit for numbers in Python. It gives you special powers to perform amazing math tricks with ease. You can create powerful arrays of numbers, do calculations like addition, subtraction, multiplication, and division, and find averages, maximums, minimums, and much more. It's like having a supercharged calculator that makes math fun and effortless. So, if you're into numbers, NumPy is your secret weapon!
What is Pandas?
Pandas is like having a super-smart assistant for data in Python. It helps you organize, manipulate, and analyze data effortlessly. With pandas, you can create tables called dataframes, slice and filter data, handle missing values, and perform calculations easily. It's your go-to tool for data magic!
Why are Pandas and Numpy important for data analysis?
As I mentioned in the introduction why we should learn these libraries let's see more important aspects of these libraries in terms of becoming machine learning proficient
Pandas allow you to handle data preprocessing tasks effectively, such as cleaning, transforming, and merging datasets. NumPy, with its powerful numerical operations, is often used for mathematical computations within machine learning algorithms.
let's consider a practical example. Imagine you're a business analyst working for an e-commerce company. You have a dataset containing information about customer purchases, such as products bought, prices, and dates. By using pandas, you can organize the data, filter out irrelevant information, calculate metrics like total sales or average order value, and perform customer segmentation.
Next, suppose you want to build a machine learning model to predict customer churn (i.e., identify customers likely to stop purchasing). With NumPy, you can handle the numerical computations required for feature engineering, creating arrays for input variables, and applying algorithms like logistic regression or random forests.
Installing Pandas and Numpy
Prompt these commands in your terminal
Installing Pandas
pip install numpy
Installing Numpy
pip install pandas
Setting up your development environment
you can set up your environment according to your wish But I would recommend to you use Jupyter notebook. As Jupyter Notebook is being used by professional data analysis because Jupyter Notebooks support code, text, and images, they provide a flexible and ideal way to manage the iterative exploration process common to data analytics and machine learning
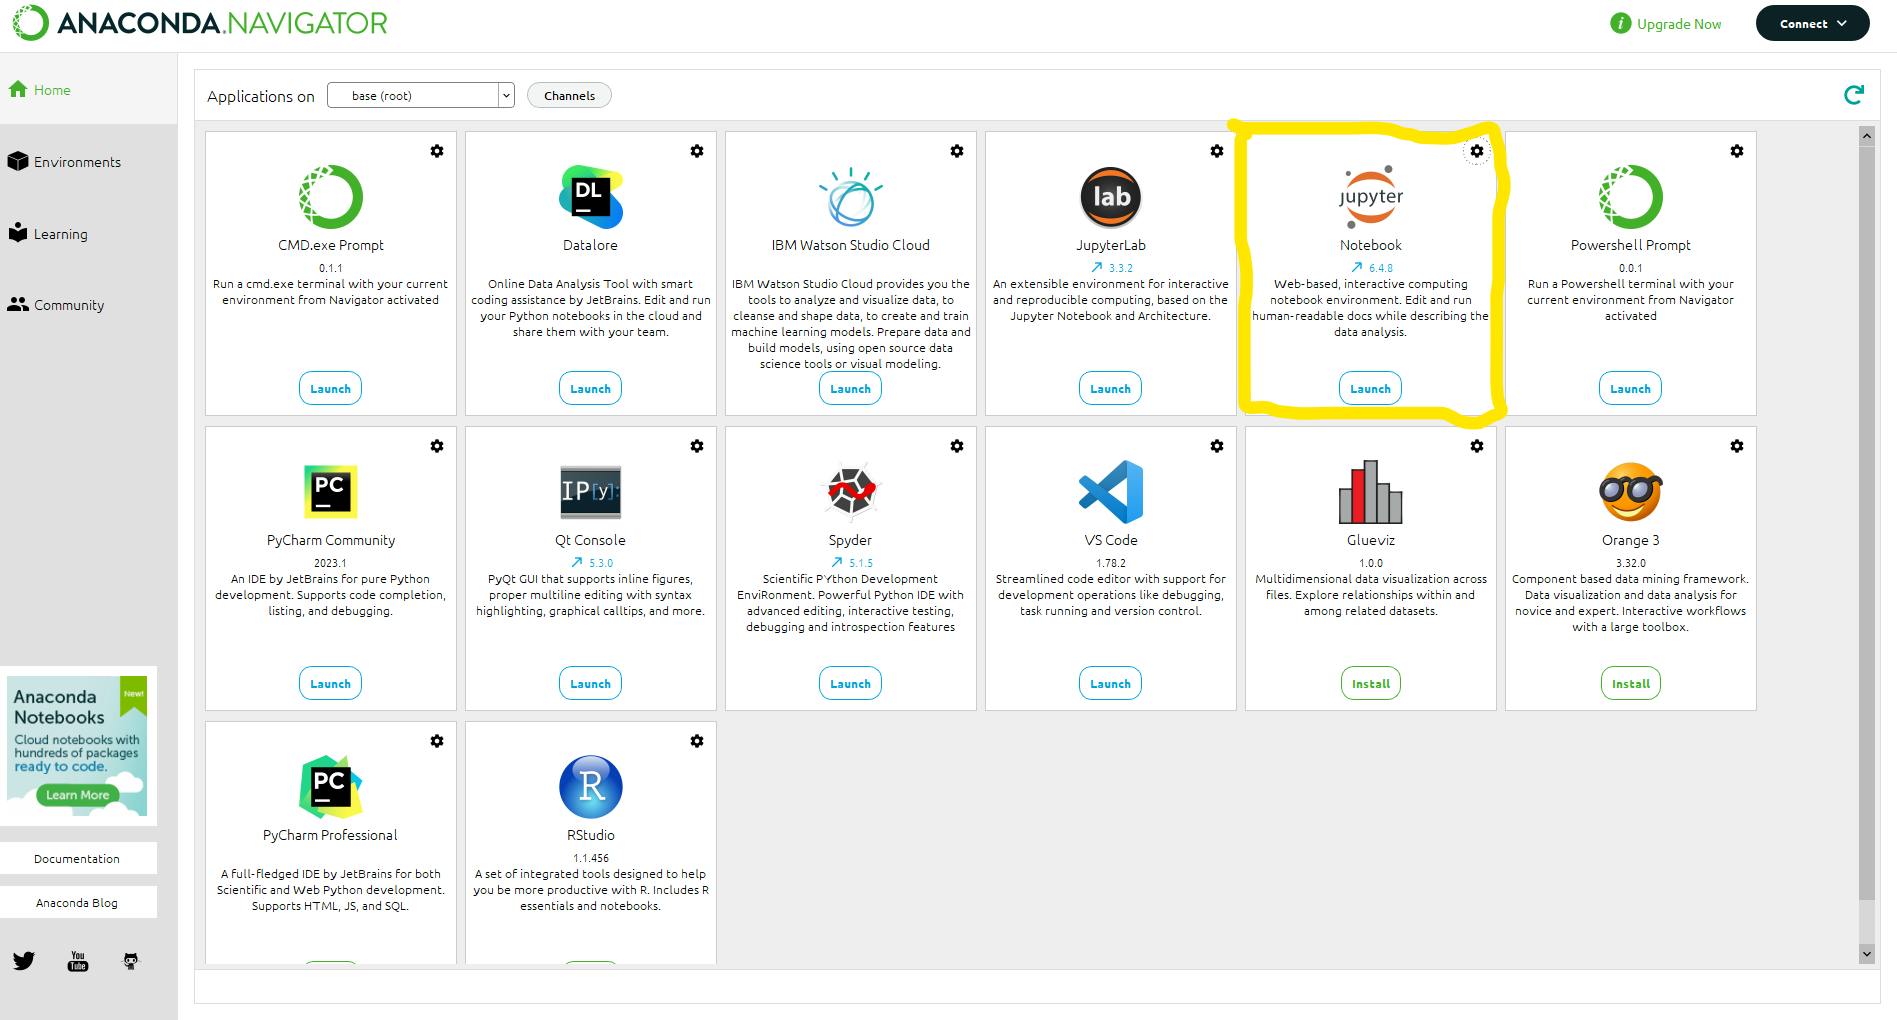
A quick guide to download and how to launch Jupyter Notebook
Enter the following command in the command prompt and press Enter. This command will install Jupyter Notebook and its dependencies.
pip install jupyterlab
#you also need to download notebook
pip install jupyter notebook
After installing type "jupyter notebook" in cmd and notebook will launch in your browser
If the above method isn't working download Anaconda world's most popular platform to deploy the Python solution link and then after downloading launch Jupyter notebook
Numpy Basics
Creating Numpy arrays
Create Numpy arrays using the Numpy.array() function, passing a sequence as an argument.
import numpy as np
array =  np.array([92,87,10,56,63])
print(array)
>>>Out: [92,87,10,56,63]
Indexing and slicing arrays
If you are familiar with list in Python same we use here to indexing array
print(array[2])
>>>Out: [10]
print(array[1:4])  # you can slice given array to extract specfic part
>>>Out: [87 10 56]
Array operations and calculations
Numpy also gives the option to element-wise calculation and operation
array1 = np.array([1, 2, 3])
array2 = np.array([4, 5, 6])
add = array1+array2
print(add)
>>>Out: [5 7 9]
NumPy has also the ability to calculate mean, max, min, and average values
#numpy for statictis
print(np.sum(add))
print(np.mean(add))
print(np.max(add))
>>>Out:21
>>>Out:7
>>>Out:9
Miscellaneous
The following are most important numpy's codes
#generates a 2x4 numpy array filled with random numbers between 0 and 1.
np.random.rand(2,4)
#generates a a random integer from 2 to 6(exclusive)
np.random.randint(2,6)
#if we want specfic array size
np.random.randint(100,size = (3,3))
Tip
Numpy to load data
file_data = np.genfromtxt('data.txt')
Pandas Basic
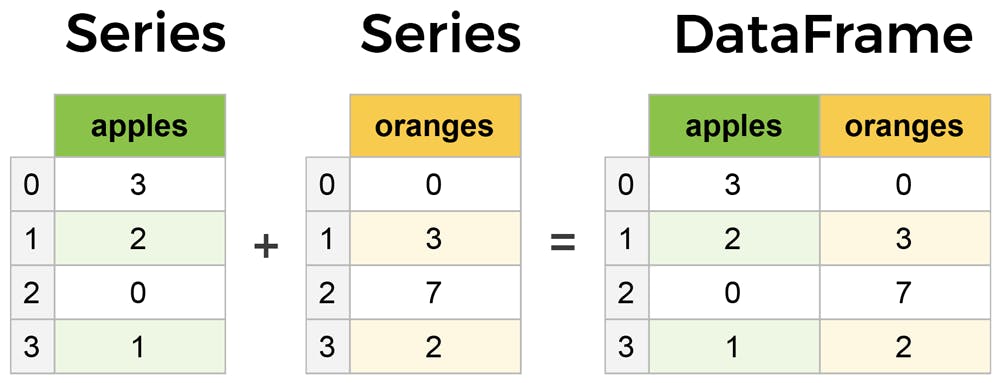
Introduction to series and dataframe
Series: It is a one-dimensional array with an index it stores a single column or row of data in dataframe.
Dataframe: Its tabular spreadsheet-like structure representation of each row and column containing multiple series.
Creating DataFrames
Let's create a random data then create dataframe
import pandas as pd
#random data from gpt
data = {'Name': ['John', 'Emma', 'Peter'],
        'Age': [25, 30, 35],
        'City': ['New York', 'London', 'Paris']}
#create dataframe
df = pd.DataFrame(data)
print(df)
Loading and saving data
pandas allow us to read, write and manipulate data from CSV file or excel
#load csv file or excel file
df = pd.read_csv('file_name.csv')
df2 = pd.read_excel('file_name.xlsx')
#save dataframes to csv file or excel file
df.to_csv('output.csv')
df.to_excel('output.xlsx')
Indexing and selecting data
In indexing, there are two important methods "loc[]" which allows indexing and selecting data of your specific row and column to a specific element and "iloc[]" which Allows indexing and selecting data by integer-based position.
age = df['Age']
print (age)
multiple_label = df[['Name','City']]
print(multiple_label)
loc = df.loc[[0,2],['Age','City']]
print(loc)
#syntax: df.iloc[row,colume]
iloc = df.iloc[1,2]
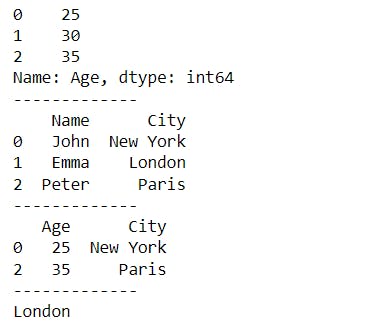
print(iloc)
Output:
Data manipulation and transformations
# Get the first few rows
first_rows = df.head(5)
print(first_rows)

# Get the summary statistics
summary_stats = df.describe()
print(summary_stats)

# Drop a column
df = df.drop('City', axis=1)
print(df)

# Sort the DataFrame by a column
sorted_df = df.sort_values('Age')
print(sorted_df)

# Group the DataFrame by a column and calculate the mean
grouped = df.groupby('City')['Age'].mean()
print(grouped)

# Merge two DataFrames based on a common key
merged_df = pd.merge(df1, df2, on='ID')
print(merged_df)
How to Analysis any datasets and draft a report
Pre-requists prompt code in terminal 'pip install pandas-profiling'
import pandas as pd
from pandas_profiling import ProfileReport
df= pd.read_csv('file_name.csv')
profile = ProfileReport(df)
profile.to_file(output_file= 'output.html')
Conclusion
In conclusion, we've covered the essentials of Pandas and Numpy for data analysis. From introduction to installation, we explored Numpy basics and Pandas fundamentals. We also discussed how to analyze datasets and create reports. Remember to practice numpy100 and pandas100 consistently and connect with me on LinkedIn or Twitter. Thank you for reading!
Happy analyzing!